Monitoring And Recording Weather On A Biodynamic Holding
Basic Meteorological Concepts
Surface Pressure Chart
(1.1, 1.2) Thousands of weather balloons are launched daily from locations around the world. They carry weather instruments that provide the data to create surface pressure charts for the globe.
The chart uses ‘lines of equal pressure’ to indicate areas of high and low pressure. (H) indicates the centre point of high pressure, and (L) indicates the centre point of low pressure.
The lines of equal barometric pressure create an overall pressure pattern, this helps us to see where the wind is coming from, and which areas are of high or low pressure. Air moves around high pressure in a clockwise direction and low pressure moves in an anticlockwise direction.
The warm front is shown by the red lines with semi-circles, while the cold front is represented by a blue line with triangles. The weather is always wanting to reach an unobtainable equilibrium, the warm and cold fronts bring with them warm and cold air respectively, which can lead to increased amounts of rainfall at the front.
The purple line with semi-circles represents an occluded front. This happens when a cold front that moves faster catches up to a warm front.
A trough is also shown, this is a thick black line that shows the area where the air is unstable. It is an indication of showers.
1.2 Actions
Barometric Pressure:
Barometric pressure is the weight of the air around us. When it’s high, the weather is usually calm and clear. When it’s low, we often get rainy or stormy weather.
High Pressure:
High-pressure areas have heavier air pushing down, which makes the weather nice and calm with clear skies.
Low Pressure:
Low-pressure areas have lighter air that rises. This rising air can cause clouds, rain, and sometimes storms.
Fronts:
Fronts are like battle zones where different air masses meet. They can create different types of weather.
- Cold Front: Cold air pushes warm air up, causing storms.
- Warm Front: Warm air gently slides over cold air, bringing light rain.
- Stationary Front: When neither air mass moves much, it can lead to cloudy, wet weather.
- Occluded Front: This happens when a fast cold front catches a slower warm front, creating clouds and rain.
Clouds Associated with Fronts:
- Cold Fronts: Tall clouds called cumulonimbus bring thunderstorms and heavy rain.
- Warm Fronts: Look for flat, layered clouds like stratus and nimbostratus, which mean light to moderate rain.
- Stationary Fronts: Expect a mix of clouds like cumulus, stratus, and nimbostratus, making the weather a bit unpredictable.
- Occluded Fronts: Clouds can vary, from cumulus to nimbostratus or cumulonimbus, signaling changing and possibly turbulent weather.
The Concept Of Temperature:
Temperature is how hot or cold the air is. It affects the weather by creating high or low-pressure areas, which, in turn, influence things like wind and rain. Forecasters use it to predict what the weather will be like. Temperature is one of the main ways that we understand the weather, as this is shown on the weather forecast.
Surface Pressure Chart Of 29th November 2021
I have selected a surface pressure chart from the 29th of November 2021. The Met Office gave an amber wind warning for England due to a period of very strong wind and cold weather. We had snowfall on Saturday morning during the course, and heavy winds, there was even a power cut which forced us to move venues.
“Storm Arwen is associated with a deep low pressure system that will impact the northeast in particular from Friday, but will also bring wider impacts to the UK with high winds, rain and some snow probable over the high ground.
“Storm Arwen’s impacts are mainly associated with high winds as the storm sinks southwards and will widely bring gusts of up to 65mph in coastal areas, although slightly stronger in the northeast, with in excess of 75mph possible in exposed locations.”
Dan Suri, Met Office Principal Meteorologist

This pressure chart shows the aftermath of Storm Arwen, with a strong cold front that is continuing its journey to the United Kingdom, as it catches up to slower warm fronts. However, there is a warm front formed across the Irish sea. This mild air will soon sweep across the whole of the UK bringing with it warmer temperatures.
The warm front is likely to produce some showers across the UK. There will be lots of clouds but the day will be much milder than those temperatures that came with the cold fronts of Storm Arwen.
The combinations of cold and warm fronts in the north of the UK will tussle together to develop strong winds, but quickly move on towards the continent.


Prevailing Winds


The prevailing wind is the wind direction that is most predominant. In the UK the prevailing wind direction varies between the south-west, and the north-west, as shown in the wind rose above. Both of these winds arrive in the United Kingdom from the Atlantic Ocean, where they pick up moisture, which later falls as rain.
Cloud Types

In 1802, Luke Howard a British chemist gave a really important talk called “On the Changes in Clouds.” In it, he came up with a way to group clouds based on how they look and act. He identified four main types: puffy clouds (cumulus), flat clouds (stratus), wispy clouds (cirrus), and rainy clouds (nimbus). These categories are still used today by meteorologists and help us understand the weather better. Clouds can be classified by their form and altitude. Here are some examples of different cloud types:


- Cirrus Clouds: These are those high, wispy clouds that look like delicate feathers or strands. The name “cirrus” comes from Latin and means “curl of hair.” They form way up high and are made of ice crystals.
- Cumulus Clouds: Think of those classic fluffy, white clouds that resemble cotton balls. “Cumulus” is Latin for “heap” or “pile,” which is a perfect description of how they look.
- Stratus Clouds: These are the low, flat clouds that cover the sky like a gray or white blanket. “Stratus” means “layer” or “spread out” in Latin.
- Nimbostratus Clouds: When you see thick, dark clouds that bring steady rain or snow, you’re looking at nimbostratus clouds. “Nimbo” means rain in Latin, so “nimbostratus” basically means “rainy layer cloud.”
- Cumulonimbus Clouds: These are the giant, towering clouds that can reach impressive heights. They’re responsible for thunderstorms, heavy rain, and sometimes hail. “Cumulonimbus” combines “cumulus” (heap) and “nimbus” (rain), indicating their stormy potential.
- Altocumulus Clouds: Altocumulus clouds are mid-level clouds that look like white or gray patches or layers. “Alto” means “high” in Latin, so they’re higher than regular cumulus clouds but lower than cirrus clouds.
- Cirrostratus Clouds: These high, thin clouds often cover the sky like a veil. “Cirro” means “curl of hair,” and “stratus” means “layer,” describing how they look.
- Cirrocumulus Clouds: Cirrocumulus clouds are small, white, and show up in clusters. Their name combines “cirrus” and “cumulus,” showing they’re high up and grouped together.
Measuring And Forecasting Weather

Stevenson Screen Weather Station
The Stevenson Screen Weather Station provides a standardised environment in which to measure temperature, humidity, and atmospheric pressure. It was designed by Thomas Stevenson in 1864 and has since been adopted by the British Meteorological Office, and other national services in the UK and Worldwide.
Following the weather course, I became interested in the idea of there being a weather station in the valley. It would work well as an activity for the first 10 minutes of a session, allowing the student to arrive, and orientate themselves in the new setting.
The results could also be sent to the MET Office. I created a worksheet that many students would be able to complete. This could then be placed into students bluebooks, so they have a record of the day’s weather to compare against other days in the valley.
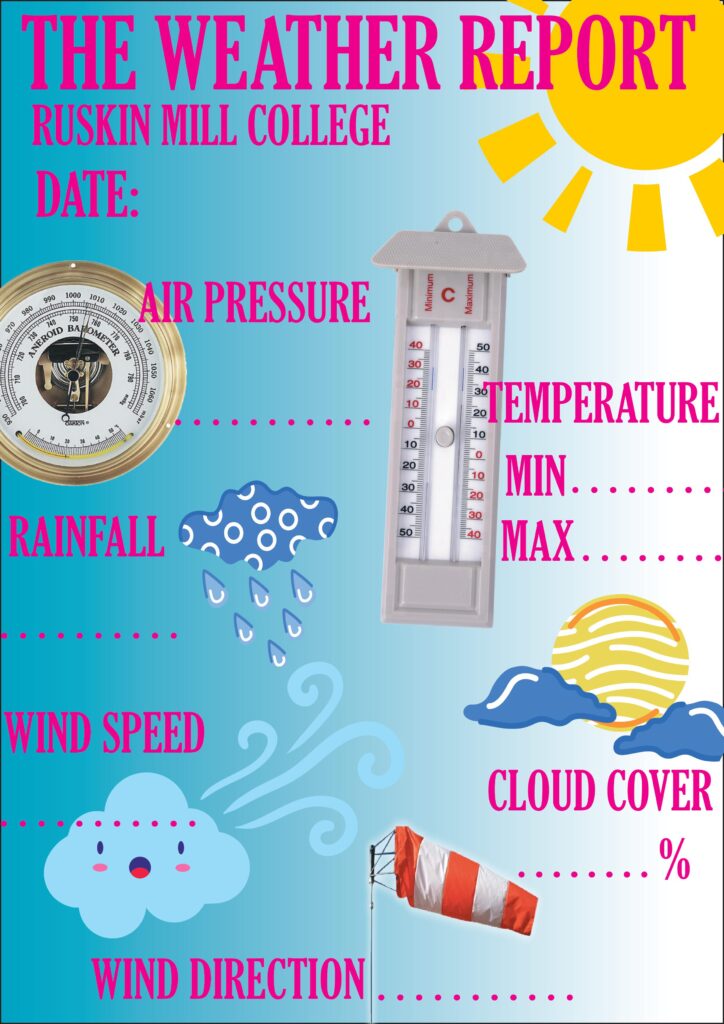
Also, the data that the students collect could be inputted into a monthly chart. (Perhaps it could be printed onto a large whiteboard in the valley landscape shed.) This would give an overview of the weather over the month, and the design of the chart should present some of the weather patterns of the month.
Precipitation

Precipitation is influenced by several key factors. The presence of moisture in the atmosphere, along with temperature, plays a pivotal role. Air masses colliding, proximity to water bodies, and global wind patterns are also critical determinants. Additionally, topography, such as mountains, can lead to variations in precipitation. Seasonal changes, climate zones, human activities, climate change, and natural climate phenomena like El Niño further shape precipitation patterns
Barometric Pressure
Atmospheric Pressure is the weight of the air, it is measured using a barometer. As mentioned in the pressure charts previously, places of the same pressure are joined together to give us isobars, that help meteorologists indicate areas of high and low pressure, and forecast the fronts.
Air that is warm rises giving it a higher pressure, and air that is cold descends increasing its pressure on the surface of the earth.

Phenomenological Approaches Of Weather Observation
(2.1) There are many ways of observing and understanding the weather. Today, many of us circumvent the feeling of weather, through climate controlled cooling and heating, and an indoor predominant lifestyle. We also experience weather though measurement. The weather forecasts are quantitative, and present us with temperatures and wind speeds, and we often use these number to inform our own understanding of weather, which real experience or conscientiousness of the weather can hide behind.
Throughout history, diverse traditional cultures worldwide have crafted ingenious methods to comprehend and forecast weather patterns. Indigenous communities, closely tied to their natural environments, honed weather knowledge by observing celestial bodies, interpreting animal behavior, discerning wind directions, and analyzing cloud formations. Such keen observations played a vital role in guiding essential activities like hunting, fishing, and daily livelihoods.
Weather-related folklore and proverbs have been instrumental in passing down weather wisdom through generations within these close-knit societies. Rooted in local context, these sayings draw on the relationships between natural elements and provide invaluable insights to agricultural communities, helping farmers plan planting and harvesting schedules in alignment with recurring weather patterns.
Additionally, various cultures employed specialized instruments such as wind vanes, rain gauges, and barometers to quantify and measure atmospheric conditions, showcasing their advanced understanding of meteorology. Ceremonies and rituals were also conducted respectfully to appease weather deities and potentially influence climatic events.
These holistic approaches to understanding weather not only exemplify practical and empirical weather knowledge but also underscore the profound spiritual and cultural connection between humanity and the natural world. These enduring traditions offer a fascinating glimpse into how different societies historically interpreted and interacted with the weather, providing valuable insights for modern scientific research and fostering a deeper appreciation for the delicate balance between human activities and the environment.
“Mare’s tails and mackerel scales make lofty ships carry low sails.” This proverb connects the appearance of cirrus clouds (mare’s tails) and altocumulus clouds (mackerel scales) with impending stormy weather. It advises sailors to prepare for rough seas and lower their sails to cope with the approaching inclement weather.
“When leaves show their undersides, be very sure that rain betides.” When you observe leaves turning their undersides up, it’s believed to be a sign of rain approaching. This observation is based on the idea that leaves tend to curl up before rain due to changes in humidity and atmospheric pressure.
“When halo rings the moon or sun, rain’s approaching on the run.” This proverb suggests that when a halo, a ring of light around the moon or sun, appears, it’s a sign of impending rain. The halo is caused by the refraction of light through ice crystals in high-altitude clouds, which often precedes a change in weather conditions.
Applying a phenomenological methodology to observations of weather
(3.1)

The clouds move from the across to my right hand side, leaving patches of shade across the landscape. The air feels light. The breeze hits my face, its cools my face, after periods of direct sunlight, but for know the sun is nestled behind a dense cloud, which disperses the light. The clouds exist on different levels in the sky, creating a layer composition, and add to the interplay of light and dark across the commons. The cloud gradually metamorphose, they are not fixed entities. Even the most dense clouds are always changing shape. The clouds tell stories, they take the from of animals and objects.
Weather Readings
(3.2)
| Date | Temperature (°C) | Wind Speed Avg (mph) | Pressure Avg (mbar) |
|---|---|---|---|
| Thursday, June 1st | 14.4 | 10.3 | 1022 |
| Friday, June 2nd | 15.3 | 10.9 | 1022 |
| Saturday, June 3rd | 17.8 | 9.4 | 1021 |
| Sunday, June 4th | 18.1 | 9.5 | 1021 |
| Monday, June 5th | 15.2 | 9.8 | 1021 |
| Tuesday, June 6th | 13.9 | 9.3 | 1021 |
| Wednesday, June 7th | 17.3 | 7.9 | 1021 |
| Thursday, June 8th | 18.3 | 9.4 | 1019 |
| Friday, June 9th | 20.8 | 11.7 | 1018 |
| Saturday, June 10th | 23.2 | 7.0 | 1018 |
| Sunday, June 11th | 22.6 | 3.2 | 1018 |
| Monday, June 12th | 23.8 | 3.1 | 1018 |
| Tuesday, June 13th | 25.3 | 10.6 | 1019 |
Analyzing the data above, we can observe interconnected patterns between temperature, wind speed, and air pressure. The data shows on average an inverse relationship between temperature and wind speed, as seen when moving from early June to mid-June, increasing temperatures seem to coincide with decreasing wind speeds. I have put this into a graph below, which clearly shows a inverse correlation.

On June 8th, there’s a noteworthy drop in atmospheric pressure to 1019 mbar, coupled with a temperature of 18.3°C and a wind speed of 9.4 mph. This could signal a potential weather event or system approaching, as it stands out in contrast to the relatively stable conditions observed through the observation period.
Furthermore, the data illustrates a moderate correlation between temperature and air pressure, evident in instances like June 9th, where a relatively high temperature of 20.8°C is accompanied by an average atmospheric pressure of 1018 mbar. Additionally, the data suggests that wind speed can be influenced by changes in air pressure, such as on June 8th, when the average wind speed is 9.4 mph, and the average atmospheric pressure is 1019 mbar. These patterns underscore the relationships between temperature, wind speed, and air pressure. The chart below, indicates this relationship.


(3.3)
The temperature data reveals a gradual increase over the observed period. Starting relatively cool at 14.4°C on Thursday, 1st June, the temperatures gradually rise, reaching their peak at 25.3°C on Tuesday, 13th June. This variability in temperatures suggests changing weather patterns and a transition between different seasons or climate conditions. As the days progress, the rising temperatures indicate the shift towards warmer weather, marking a transition from spring to summer during this time frame.
The air pressure was quite stable during this period, which indicates fairly consistent weather conditions. Which shows that it is unlikely to rain in the following days after the observation period.
Understanding the connection between air pressure, wind speed, and temperature in weather is crucial. High-pressure systems bring stability and warmth, leading to clear skies as sinking air heats up. On the other hand, low-pressure systems, with rising air, cause instability, clouds, precipitation, and cooler temperatures as ascending air cools. Wind speed is driven by pressure differences, moving air from high to low-pressure areas. This wind can carry either warm or cool air depending on its source, significantly impacting local temperatures.”

Effects Of Local Weather Patterns
(3.4) Valley Landscape is located in the Horsley Valley, which creates a micro-climate. The weather can be very different to the weather seen at Gables Farm. The experience of wind and light is very different, even though they are located within one mile of one another.
Frost can kill or damage sensitive plants and crops. Plants such as tender herbs, beans, and tomatoes can only be planted after the last frost date, although the polytunnel in Valley Landscape extends our time scales to propagate plants earlier than outside conditions would allow.
The shape of valley, protects us from the worst of the prevailing winds. Although strong winds can take about moisture from the plant and soil that can effect the growth and vitality of the plants. Transpiration realizes water vapor from plant leaves and stems into the surrounding atmosphere, this can dry out the plant, and disrupt the transportation of nutrients.
Heavy rain can effect the market garden and workshop considerably. Due to the amount of paving and slabs rain water can accumulate in the puddles, also flood drainage is located in the valley, and this had become block and flooded areas of the site before. It can also wash away soil from the beds.
Extreme temperatures can have distinct effects on plants. When it gets really hot, which we call heat stress, plants may start wilting because they lose water quickly. Their growth can slow down, and they might drop their flowers and fruits prematurely. Plus, they become more vulnerable to pests and diseases, and you might notice their leaves getting scorched, especially around the edges.
On the flip side, when it gets very cold, known as cold stress or frost, it can be tough on plants. Freezing temperatures can cause ice crystals to form inside plant cells, potentially damaging them. This can result in stunted growth, reduced ability to produce energy through photosynthesis, and even damage to their roots. In severe cases, parts of the plant can die off, and it might take longer for them to bloom or bear fruit. Cold stress tends to affect the more delicate parts of plants, like young shoots and budding flowers. So, both high and low temperatures can really impact the health and productivity of plants.
(3.5) The local weather patterns have a significant impact on crop planning, sowing times, and planting times. Frost-sensitive crops may need to be planted after the last frost date to avoid damage, while cold-tolerant crops may be sown earlier to take advantage of the longer growing season.
Additionally, monitoring rainfall patterns and temperature fluctuations is essential for managing irrigation and ensuring plants receive adequate water and nutrients for healthy growth.
In the polytunnel we make sure that their is enough air circulating. The bottom leaves of the cucumbers are taken off. We use a drip irrigation on the tomatoes, and peppers. While the tomatoes are irrigated through a drip feed. We open the doors on hot days but may keep them closed on cooler days in the summer.
In the market garden, we try and plant crops close together to help retain moistures. If there isn’t enough moisture then we have to water them, some rows are hooked up with irrigation but often we water with a watering can. Our bed are raised which helps when it rains too much, as the water drains from the crops. When a crop is newly transplanting we ensure that it gets plenty of water during the early stages of development.
Often we decide to cut the grass prior to expected rain, this ensure that the grass is able to grow but lush.
Avoiding digging the soil when it’s wet is essential for maintaining healthy soil and promoting successful plant growth. When the soil is wet, it becomes compacted and heavy, losing its natural structure and becoming more challenging to work with. This compaction leads to poor aeration and drainage.
Experiencing Weather
How They Affect Land Based Activities?
(3.6)
To establish a right connection with warmth, we should accustom epileptic children — really all children, but particularly epileptics — to feel the warmth.
Rudolf Steiner, Lecture 3, The Curative Education Course
The weather has a tremendous effect on students and staff. As we transition through the four seasons of the year we can also notice changes to the inner and outer nature of students. It is mid-winter as I write this, and I can feel the earth breathing in, and the people around me like nature, are inwardly focused more than other times of the year.
Winter
During the winter I often get into a habit of waking up late, my body waits for the sun to have risen before I wake. Also, in the early evening, I feel that it is much harder to be motivated to go out once its dark. I have to work hard to break this pattern and create a new waking rhythm that is much more beneficial for my health, and one that provides me with more time.
Students need the most encouragement during the winter, the coldness makes it much more challenging to be working outside. During this time it is important that students are dressed up warmly. In the Curative Education Course Steiner even states that “Epileptic children should be clothed in such a way as to induce a tendency to sweating; sweating should be always mildly present in them in nascent state. They should, in fact, be a little too warmly clad. This is real therapy.”
I believe that the indoor spaces should be carefully adapted to bring a feeling of warmth, in a welcome space of retreat from the cold weather. Following the Candlemas festivities at Ruskin Mill College, all of the workshops installed some fairy lights to create a sense of light as we passed the equinox, and the amount of daylight began to wain. These lights go a long way in creating a sense of warmth. In the Valley Landscape shed, the is a fireplace, Students will always sit near the fire once they arrive. Interesting a fireplace so small, in a poorly insulated building with a huge sliding door could never heat up the room. But it does provide a social warmth. Aongus Gorden briefly touched on this during his introductory lecture on Weather. He mentioned the thought process that went into developing the Valley Landscape Workshop. There needed to be a place that would shelter students from the elements, there needed to be a patio space where students could escape the mud, there needed to be a polytunnel so students could still garden during poor weather, and there need to be warmth space or a social warm space.
During the winter its important that everyone is suitably dressed. I know students that have arrived to a garden session wearing their brand new white trainers without bringing a spare pair of work boots. It’s important that each workshop has some extra wellington boots. On the fish farm, they have a whole box of spare clothes, this has been vitally important as students (and staff) will inevitably fall into the ponds, and need a spare set of clothes.
Spring
With Springtime comes a sense of awakening. We have collectively endured the long nights of winter, eased through festivals of light, and Christmas. With the increased amount of sunlight, nature is renewed, and energy is abundant. For me, the beginning of Spring is the beginning of the year. It is the time when we will start planting our seeds, it is a time of great potential.
The days are much warmer, and students are more attracted to working outside. It is a time for beginning new things. It is a good time for students to identify projects that they could work on through the year.
The indoor space will become used less but is still important to ease the effects of unpredictable weather.
https://rmets.onlinelibrary.wiley.com/doi/abs/10.1002/wea.301 Seasonal variation of the prevailing wind direction in Britain
https://dennisklocek.com/interview-dennis-klocek-climate-study-das-goetheanum/